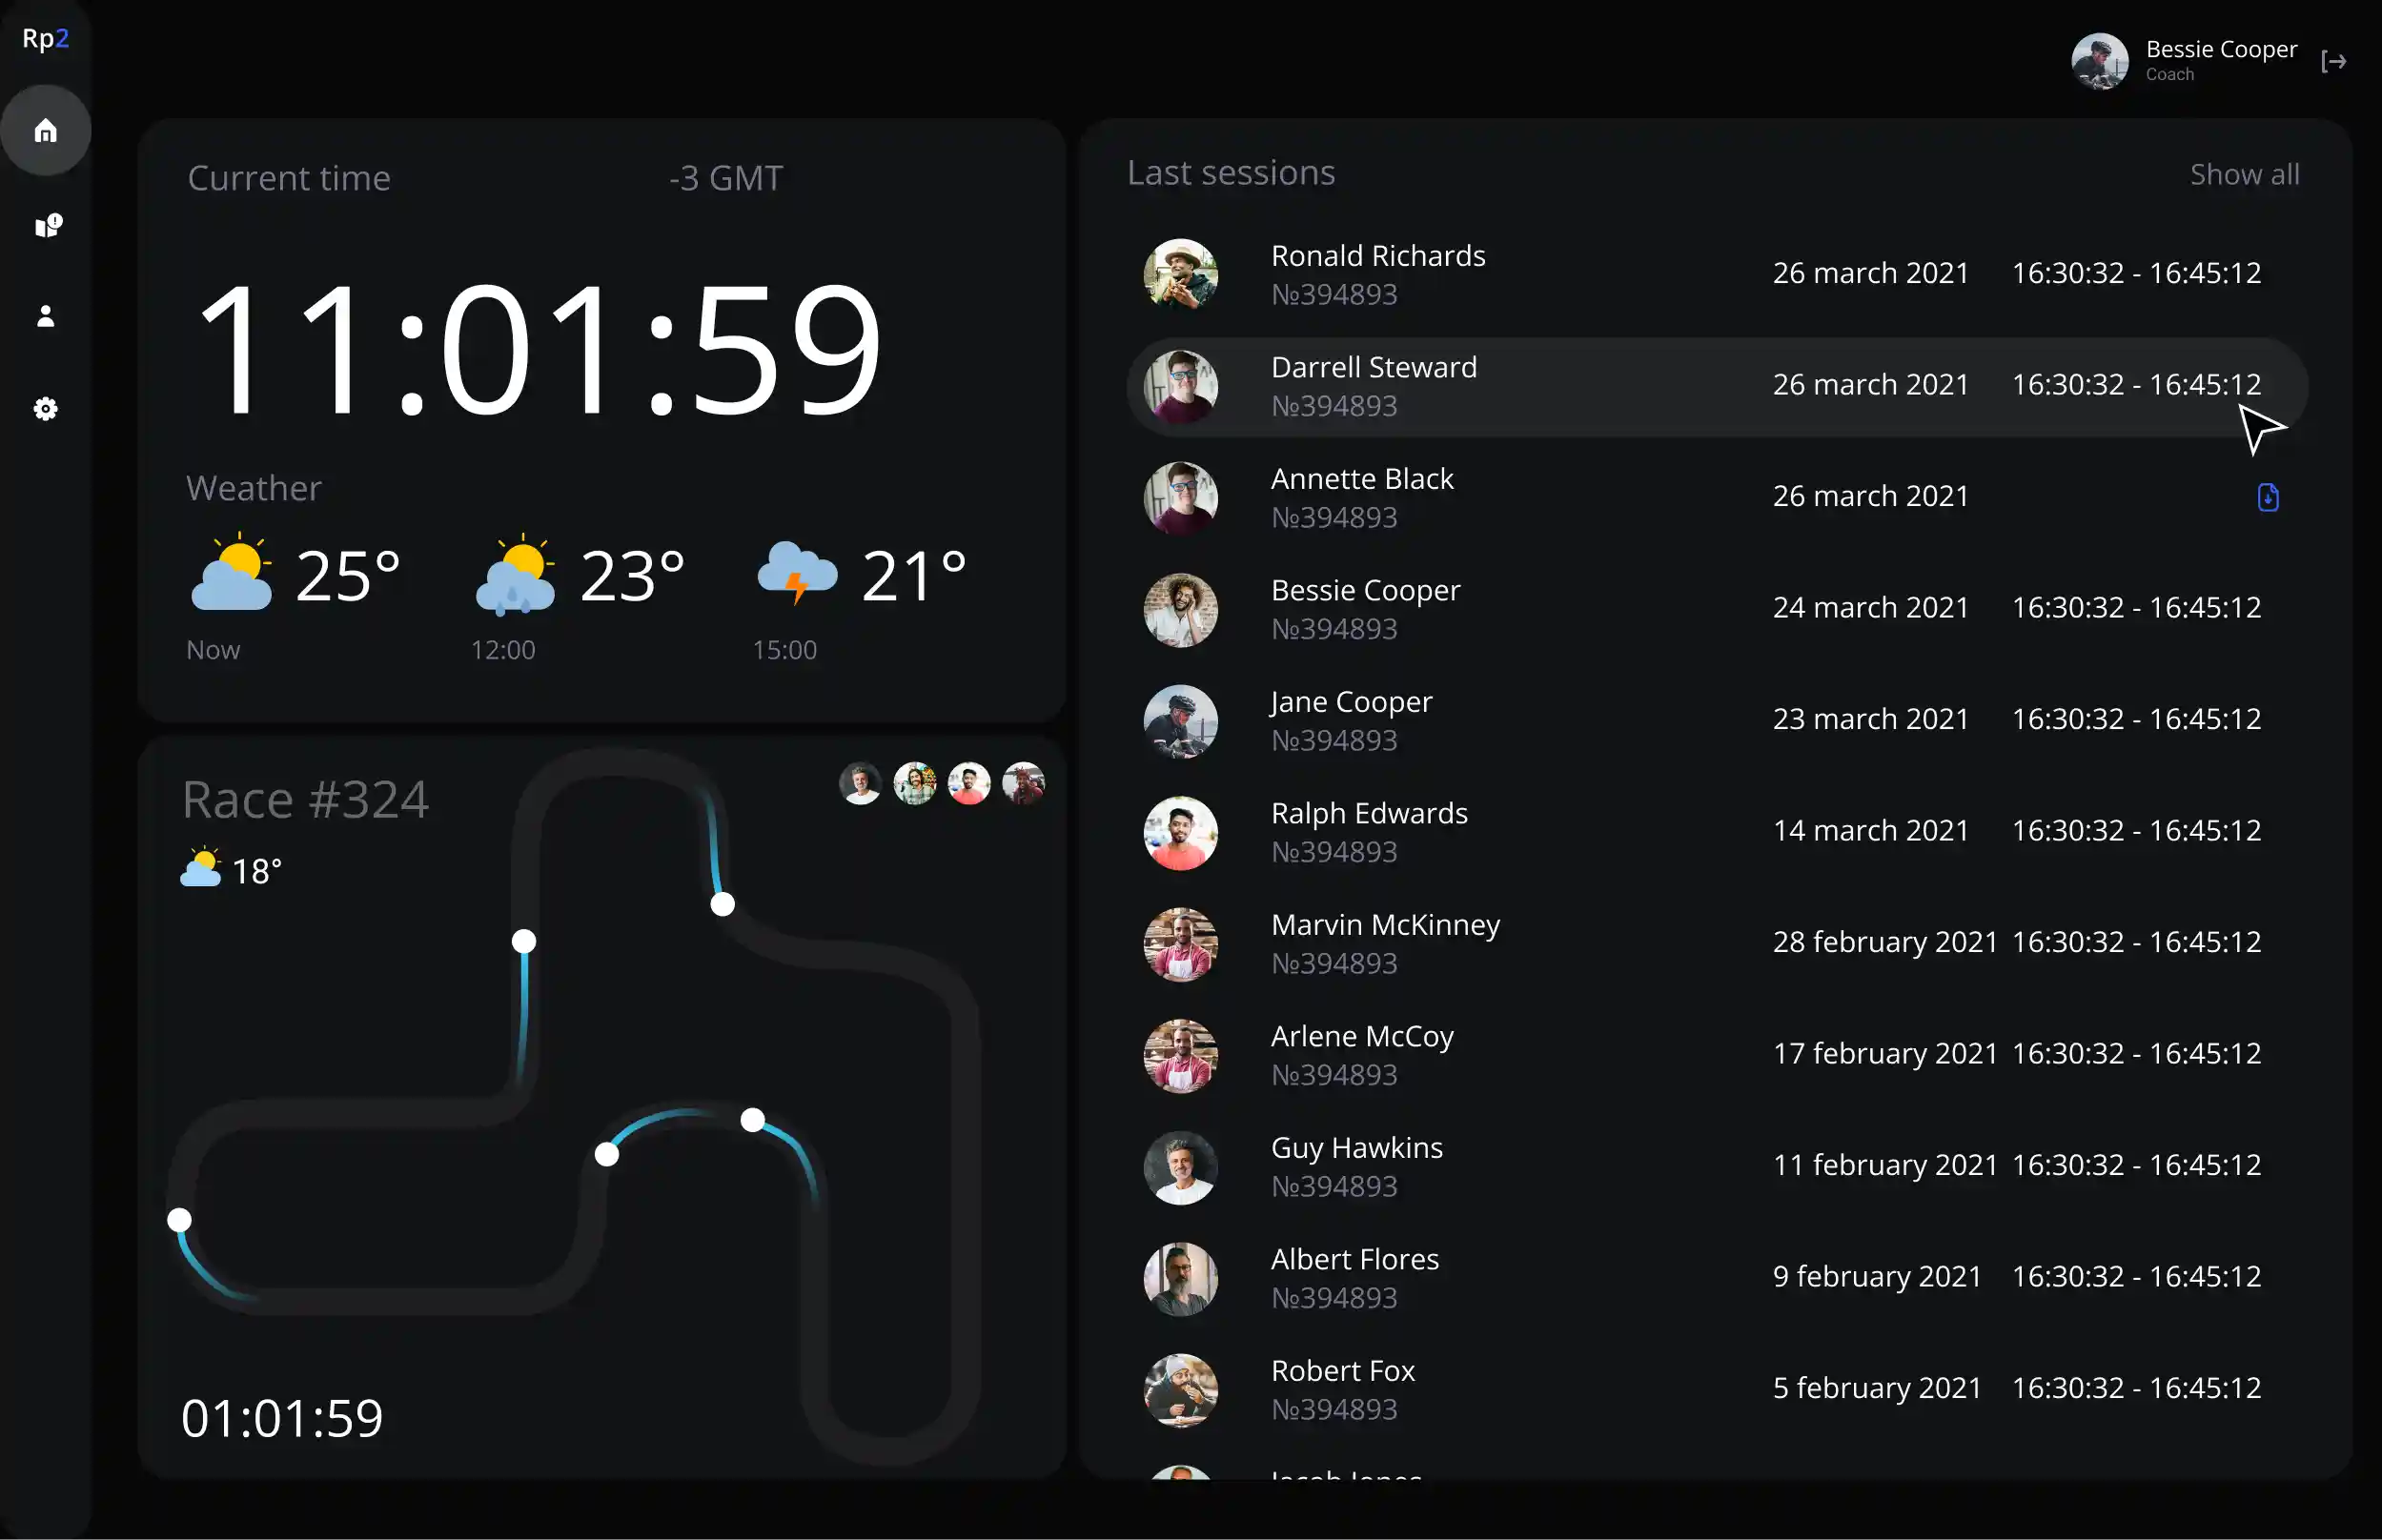
The informational structure of the RP 2 system was developed through close collaboration with the client and grounded in direct user research with racers and trainers. We conducted interviews and feedback sessions to uncover real-world needs and cognitive habits of users interacting with performance data.
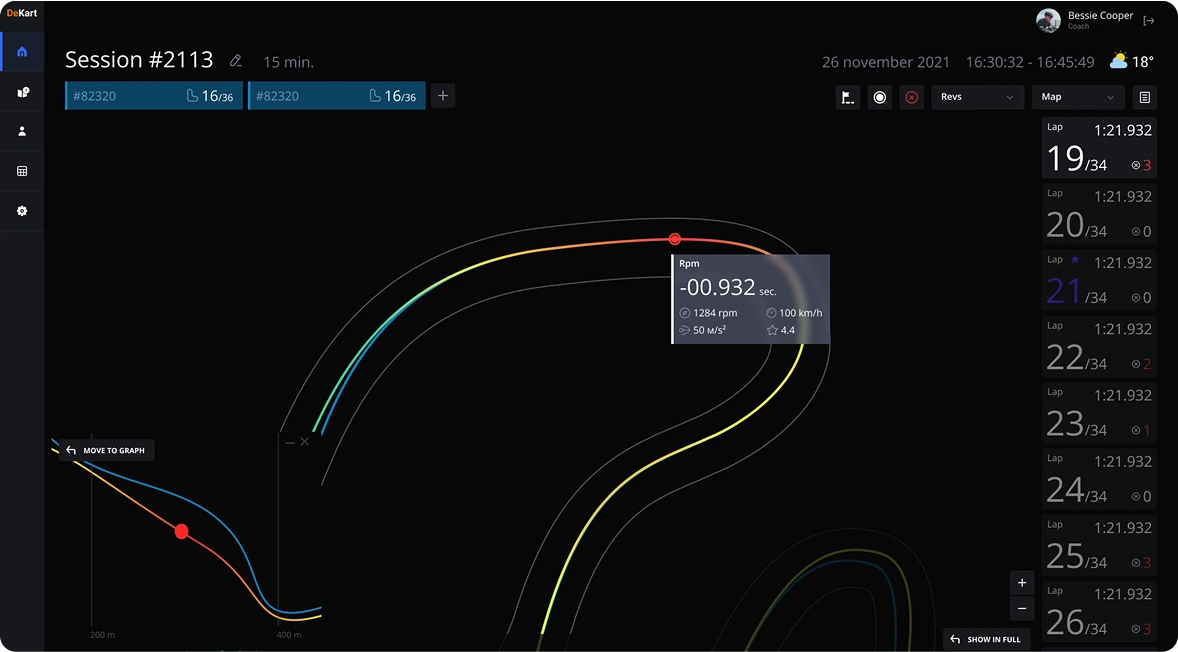
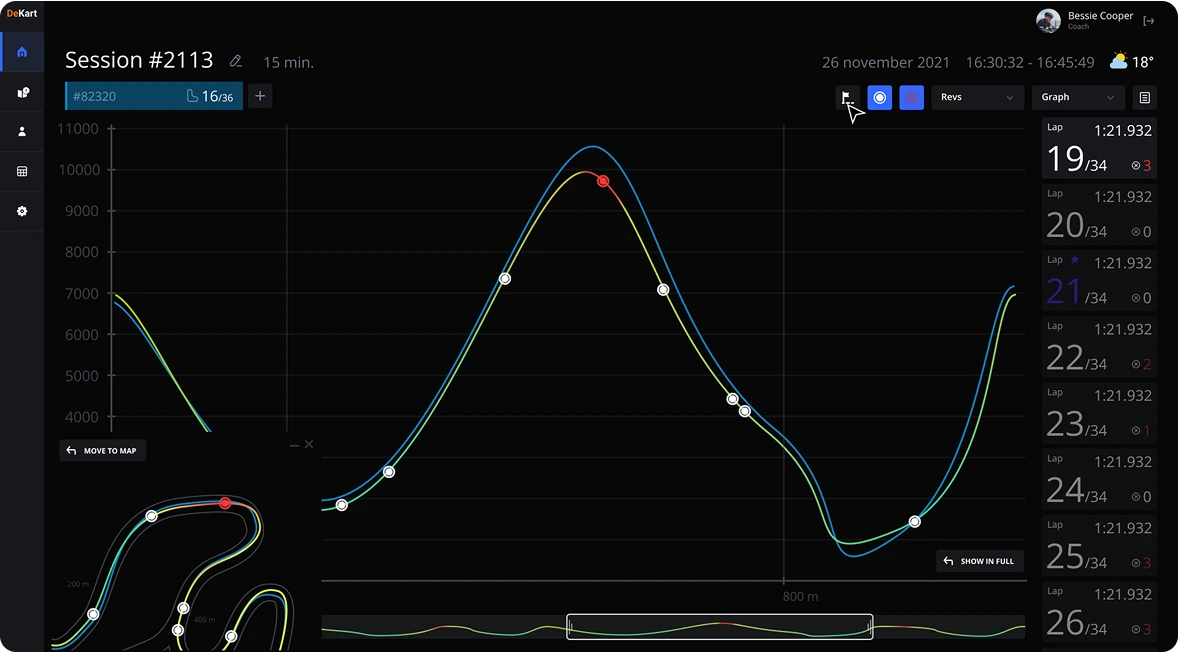
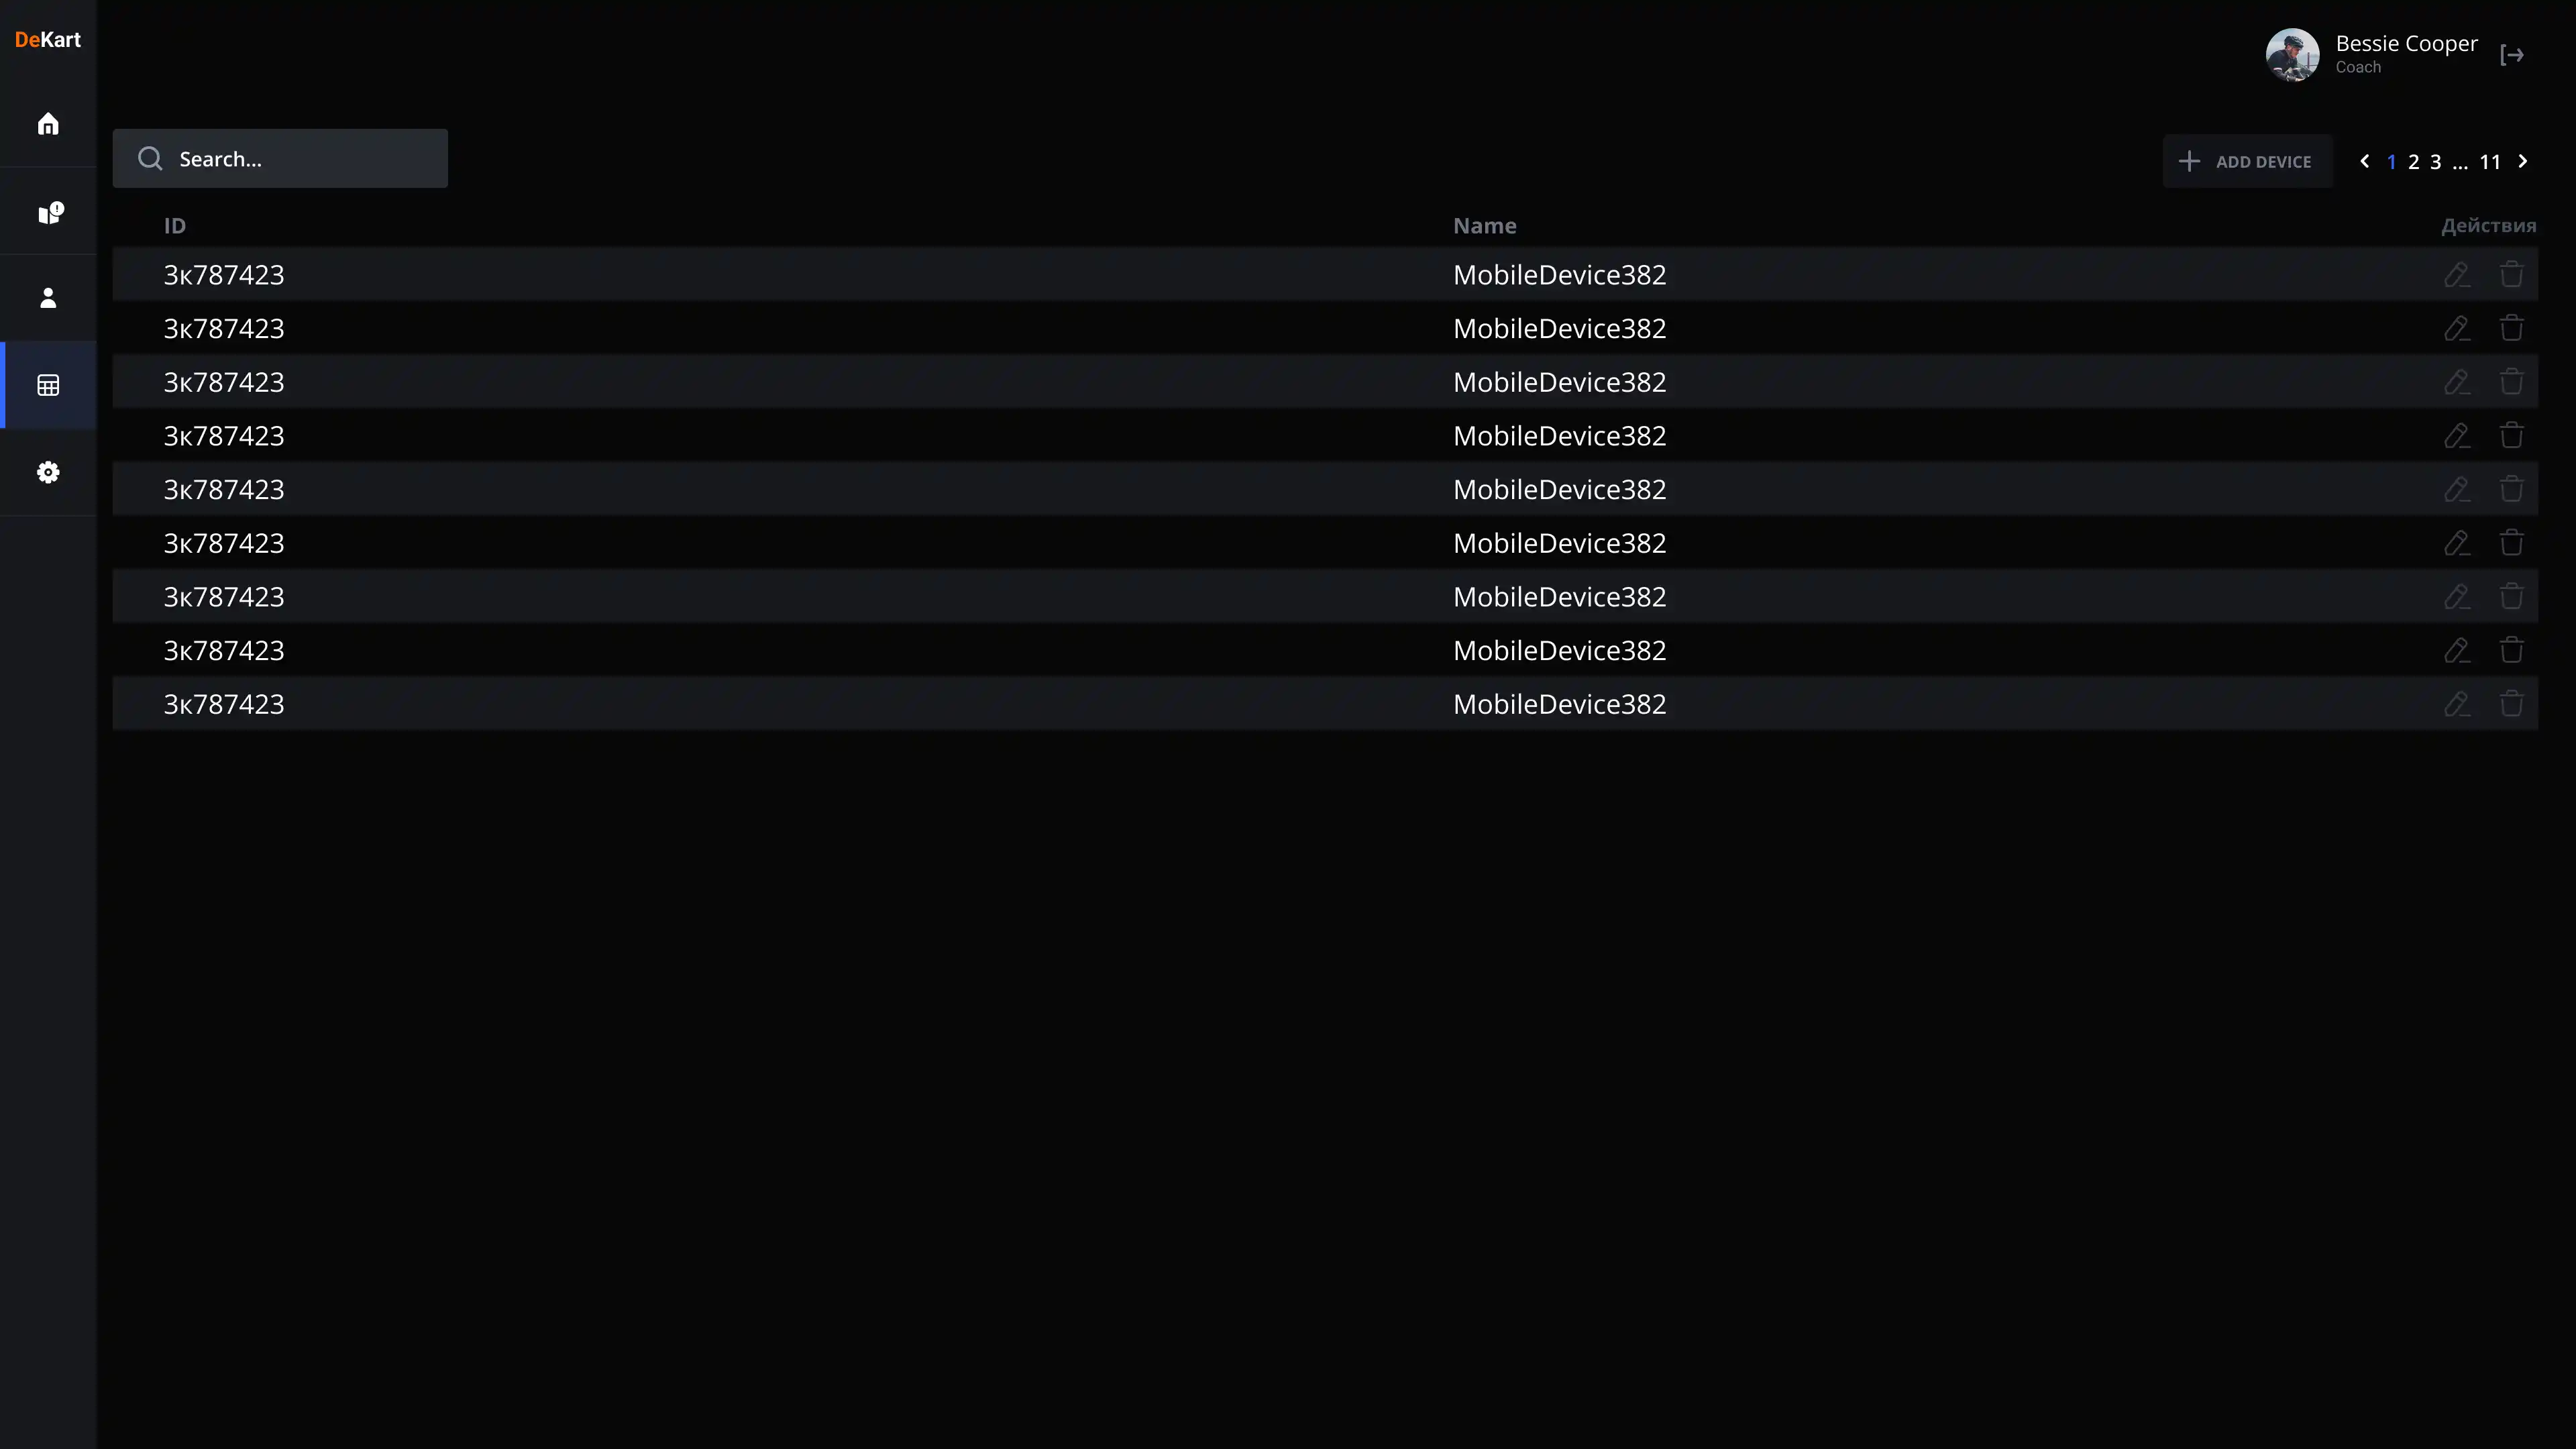
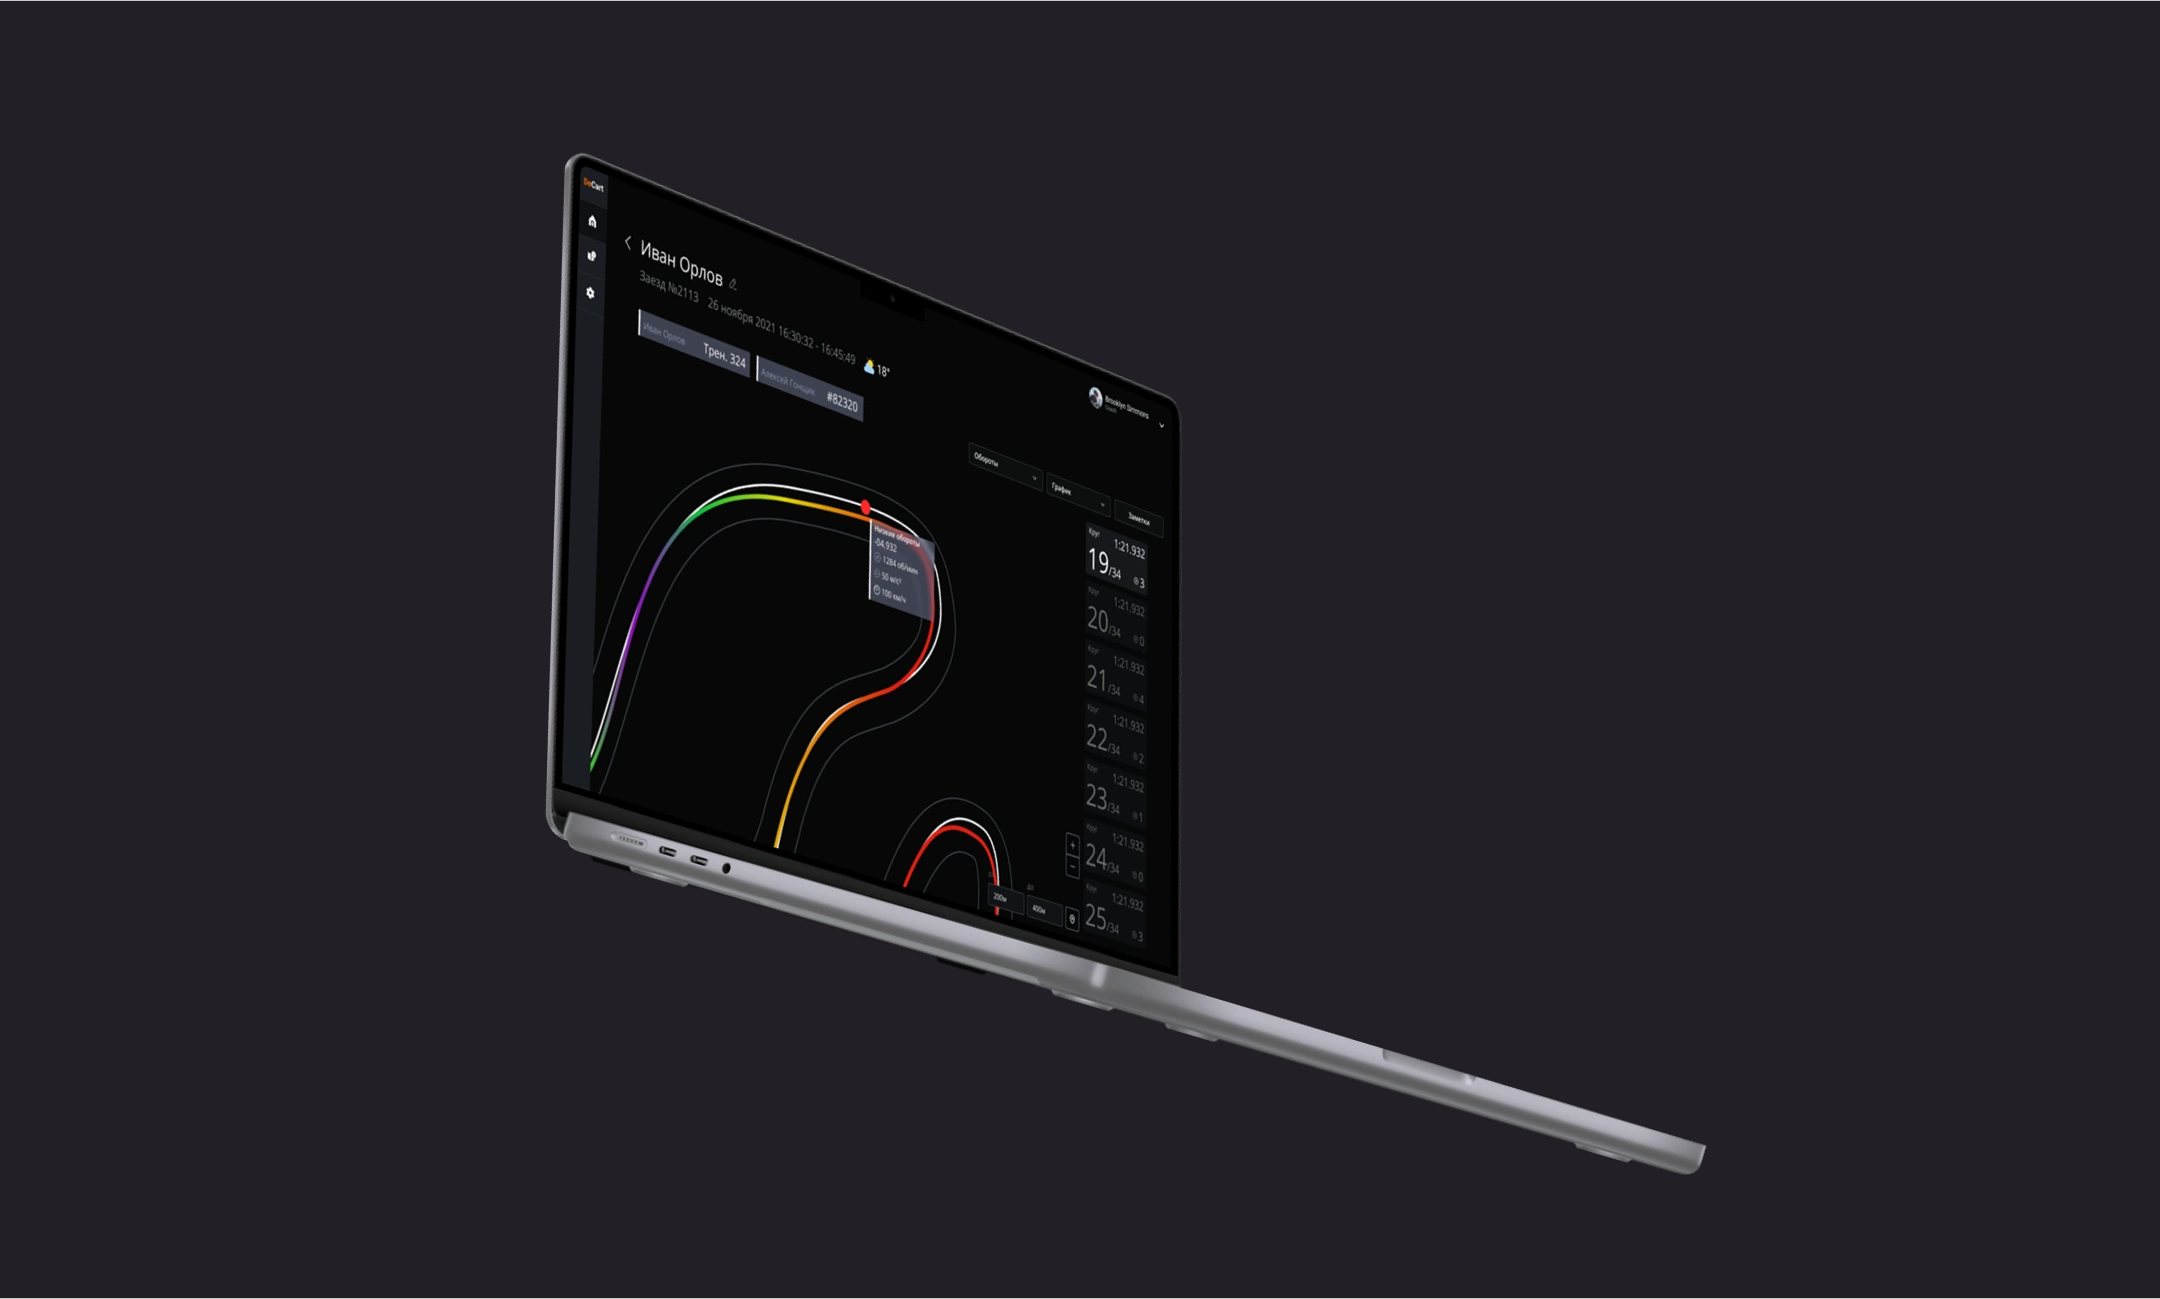
Based on this, we organized the app's content hierarchy to focus on clarity, speed of access, and relevance of insights - prioritizing trajectory comparisons, sector performance, and key error highlights. This ensured that both amateur and professional users could instantly grasp their strengths and weaknesses, without needing to decode complex data.

Based on this, we organized the app's content hierarchy to focus on clarity, speed of access, and relevance of insights—prioritizing trajectory comparisons, sector performance, and key error highlights. This ensured that both amateur and professional users could instantly grasp their strengths and weaknesses, without needing to decode complex data.


.webp)

.webp)
.webp)